User's Guide
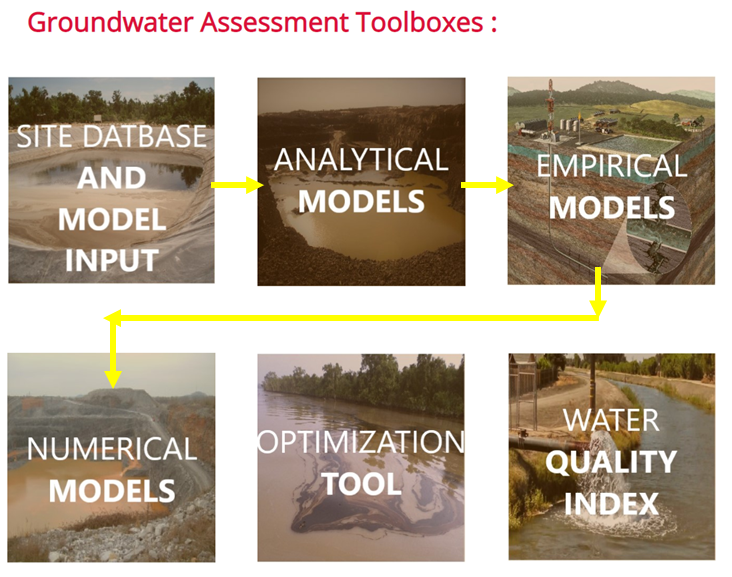
You can begin by using the sites database model :
- Create your own database by either entering all parameters manually or upload a .csv file (you can download a sample csv file for checking the format to ensure that your file can be successfully uploaded).
- You can also continue without creating your own database.
- Navigate to ‘Analysis Visualisation’ and then, to ‘All plots’ to see the visualisations available.
- Starting with the bar graph, you would be able to see that your database(in case you have created one) would be merged with the original database(already provided in the site).
- Similarly, you can navigate to the boxplot, scatterplot and histogram to visualize different types of density curves and fits for important parameters like ‘Plume length’.
- The statistical analysis page provides you with an overall description of the original database by giving the quartiles, counts, etc.
- After using this toolbox, you can move onto the analytical and empirical models.

- Read the documentation for the equation that you want to use.
- The single computation mode for each equation will require only one entry for each parameter.
- The outputs for the single computation mode will be the ‘Maximum plume length’ and a graph displaying the plume lengths in the original database and one that is calculated with the user inputs.
- The interactions for the graph can also be done via sliders, which have the most sensitive parameters.
- By changing the values in the sliders, the displayed value for plume length as well as the entry on the graph changes, making it easier for the user to visualise their results.
- The multiple computation mode for each equation allows multiple entries to be entered into the database. A separate table is created for each equation in the database.
- For using this mode, the entries for the equation can be entered manually or can be uploaded via a .csv file.
- For this purpose, please check the sample files for each parameter, to ensure that your file gets uploaded successfully.
- After creating your own database, your entries are shown along with the original database on a graph, this helps to visualize and compare all entries.
- If you wish to see only some of the entries from the original database, you can choose them from the dropdown.
For the numerical model, enter all the values of the parameters to get a ‘Maximum plume length’ according to the values entered.